
Watch how COVID-19 developed and then spread from continent to continent and then country to country with time lapse graph.
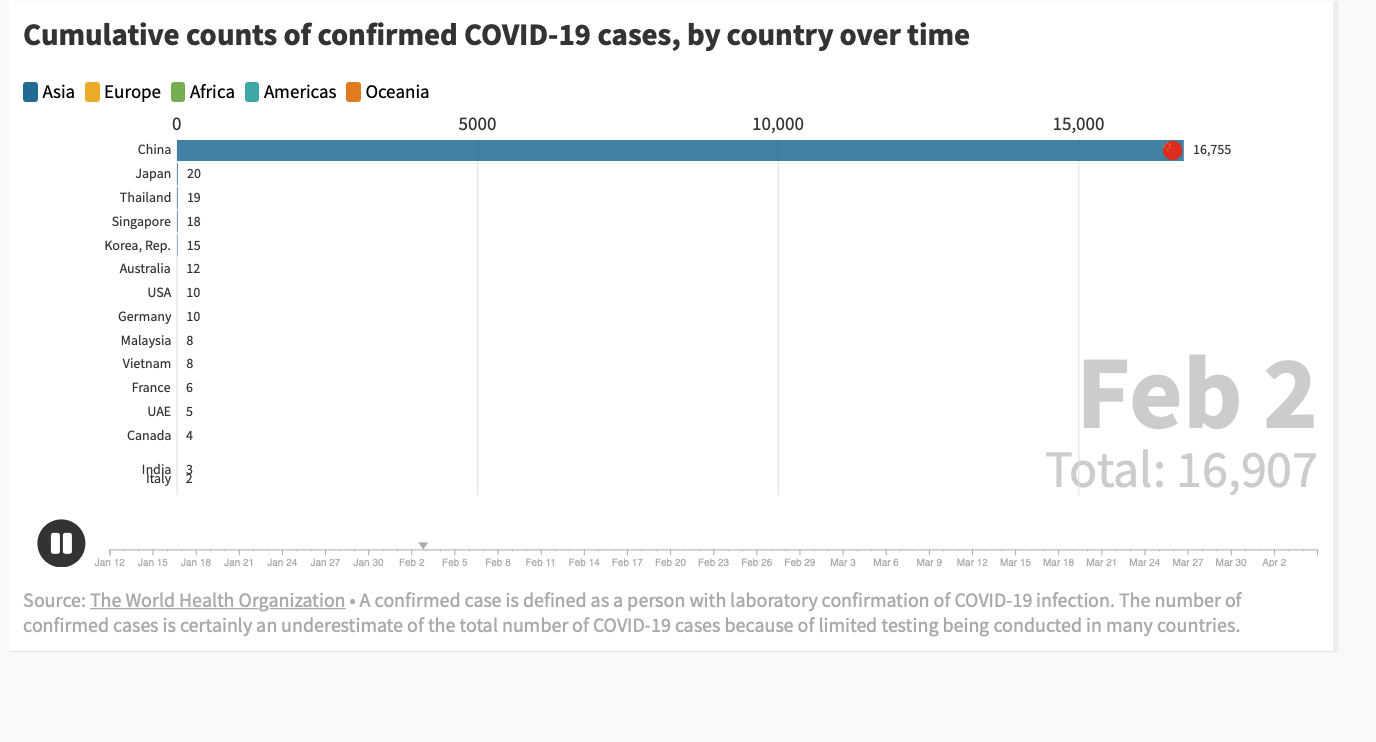
Paolo Abarcar’s graph features the top 15 infected countries that are or were dealing with COVID-19. Yes, Canada is featured.
The graph moves through each day, showing the dramatic growth of COVID-19.
Beginning on January 12, 2020, the graph begins when there were only 42 cases of the new coronavirus.
At the time, China had reported 41 cases, and Thailand had published only one case.
The graph moves through the last three months, until April 5, when the World Health Organization (WHO) reported there were 1,133,046 COVID-19 cases worldwide.
Abarcar Used data from WHO, which is based on what the organization considers confirmed cases, “A person with laboratory confirmation of COVID-19 infection. The number of confirmed cases is certainly an underestimate of the total number of COVID-19 cases because of the limited testing being conducted in many countries.”

The graph features different colours for each continent: Asia, Europe, Africa, the Americas, and Oceania. Viewers can see how fast the pandemic moved through Italy, Spain and United States. As well as our country Canada.
Viewers can watch the graph as countries are infected and deal with the pandemic.
While there were only a few countries affected in the first two months, by March 12, 2020, you can see how fast COVID-19 spread in the last month.
Remember: Stop the spread. Stay home.
Featured on Flourish, visit here to view the graph.